Using tools like tcpdump are very useful when troubleshooting not only network problems but applications as well. For windows systems I've always used Wireshark and tcpdump is great choice for most *Nix distros and even appliances like Load Balancers.
VMware ESXi 5.5 has introduced a new feature for capturing packets called pktcap-uw. It will allow you to capture packets for vmkernel ports, physical vmnic interfaces and even traffic of specific VM running on the host. You can learn more about it here:
But for this article I will show you how to do a capture for a specific VM. The first thing you will need to do is enable SSH & ESXCLI on your host. This will allow you to SSH to the host. If you have console access you can also gain access to the shell by using ALT-F1 after enabling troubleshooting mode.
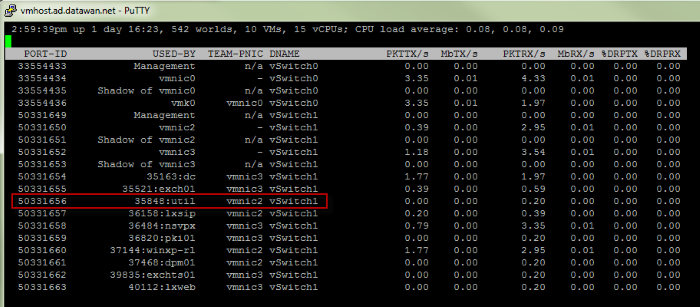
Once you have logged on via SSH or console you first need to figure out the port # in use by the VM. You do this by using the ESXTOP utility and pressing "N" for network. This will list all VM's and the port in use. See image below:
Another way to find the PORT-ID of a VM is to use the following commands:
esxcli network vm list | grep -i VMNAME
esxcli network vm port list -w WORLDIDNUM
I'm going to capture traffic for the server named "util". The port number I need to use in my capture statement will be "50331656". I exit the screen above by hitting "q". The command to capture traffic for the Util server is below:
pktcap-uw --switchport 50331656 -o /vmfs/volumes/DAS-PROD/util/capture1.pcap
The command above will capture ALL traffic. You can narrow down your capture by using filters like destination/source port, ip or protocol type. The command below shows the same capture but this time filtering for protocol TCP only.
pktcap-uw --switchport 50331656 --proto 0x06 -o /vmfs/volumes/DAS-PROD/util/capture1.pcap
Notice that we are using Hex for proto. You can find the complete list of protocols in Hex here:
http://en.wikipedia.org/wiki/List_of_IP_protocol_numbers
You quit your capture by hitting CTRL+C. You can then grab your PCAP file by browsing the datastore where you save the file and open it up with Wireshark.
You can also verify that there are no active captures using the following command and kill any found with the "kill" command:
lsof | grep pktcap-uw | awk '{print $1}' | sort -u
kill $(lsof | grep pktcap-uw | awk '{print $1}' | sort -u